Lieflat Charts
Introduction
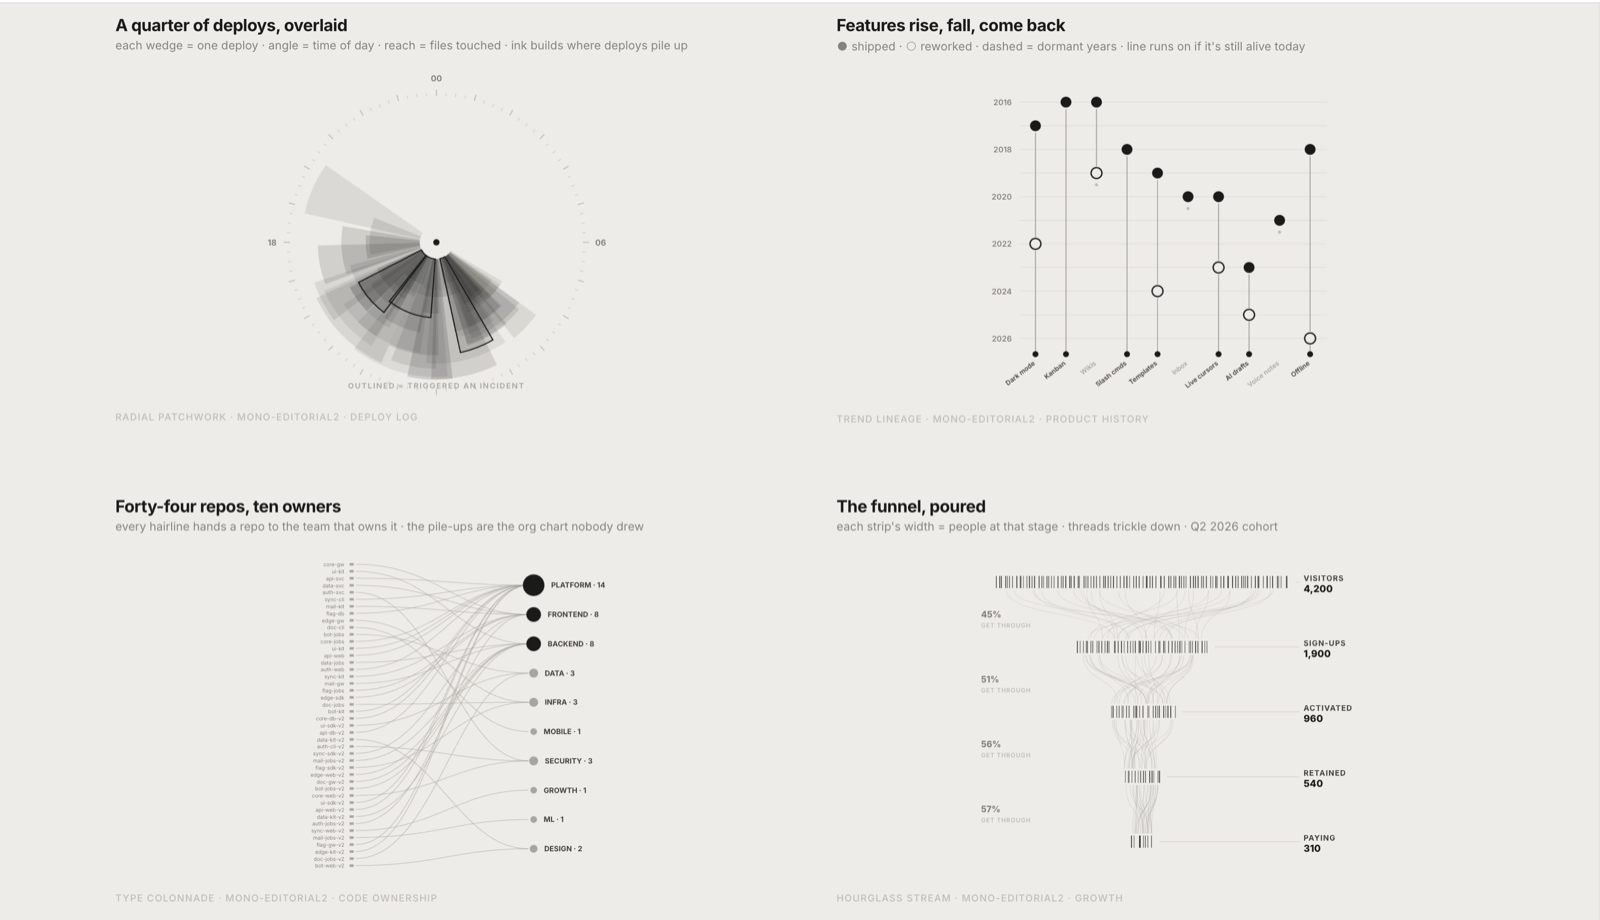
A data-visualisation Skill for AI agents that turns data into polished, interactive HTML charts. It supports a range of chart types and works with AI coding assistants such as Claude Code and Codex, making it quick to produce reports and data presentation pages. Free to use.
Install
One command:
npx skills add https://github.com/larashero3-dotcom/lieflat-charts --skill lieflat-chartsOr send this to any AI agent with shell access:
Help me install lieflat-charts. Clone https://github.com/larashero3-dotcom/lieflat-charts
into ~/.claude/skills/lieflat-charts, then verify SKILL.md, templates/, catalog.md
and mono-tokens.js exist.
For Codex, use ~/.codex/skills/lieflat-charts as the install path. Already installed? Run git pull inside the skill directory to update.
Usage
Just ask the agent, for example:
"Turn this survey data into 5 Chinese charts for a long-form article"
"Make this CSV a Glance chart I can drop into a weekly report"
"Redesign this dataset in Lupi style, keep every real record"
"Re-color this chart with the Porcelain preset, keep the structure"
The agent picks between Lupi Editorial, Lupi Basics, Glance and the color presets (Porcelain / Palm / Wire) based on the data contract. For the most complete workspace experience, use it in Moxt.
安装(中文)
一条命令:npx skills add https://github.com/larashero3-dotcom/lieflat-charts --skill lieflat-charts;Codex 路径换成 ~/.codex/skills/lieflat-charts。已装过就进目录 git pull 更新。安装后直接说需求,例如「把这份调研数据做成 5 张中文版图表」「把这个 CSV 做成 Glance 图表」「用青瓷蓝预设重做这张图」。推荐在 Moxt 中使用,体验最完整。
FAQ
- Lieflat Charts 生成什么格式的图表?
- 生成精致、可交互的 HTML 图表,支持多种图表类型。
- 适用于哪些 AI 编码助手?
- 适用于 Claude Code、Codex 等 AI 编码助手。
- 典型用途是什么?
- 帮助快速制作报告与数据展示页面。
Ratings and comments
Public feedback from people who used it.
No public comments yet.